
Part 2 ..War
Current Tankers held at Straights of Hormuz , Now closed to Transit..
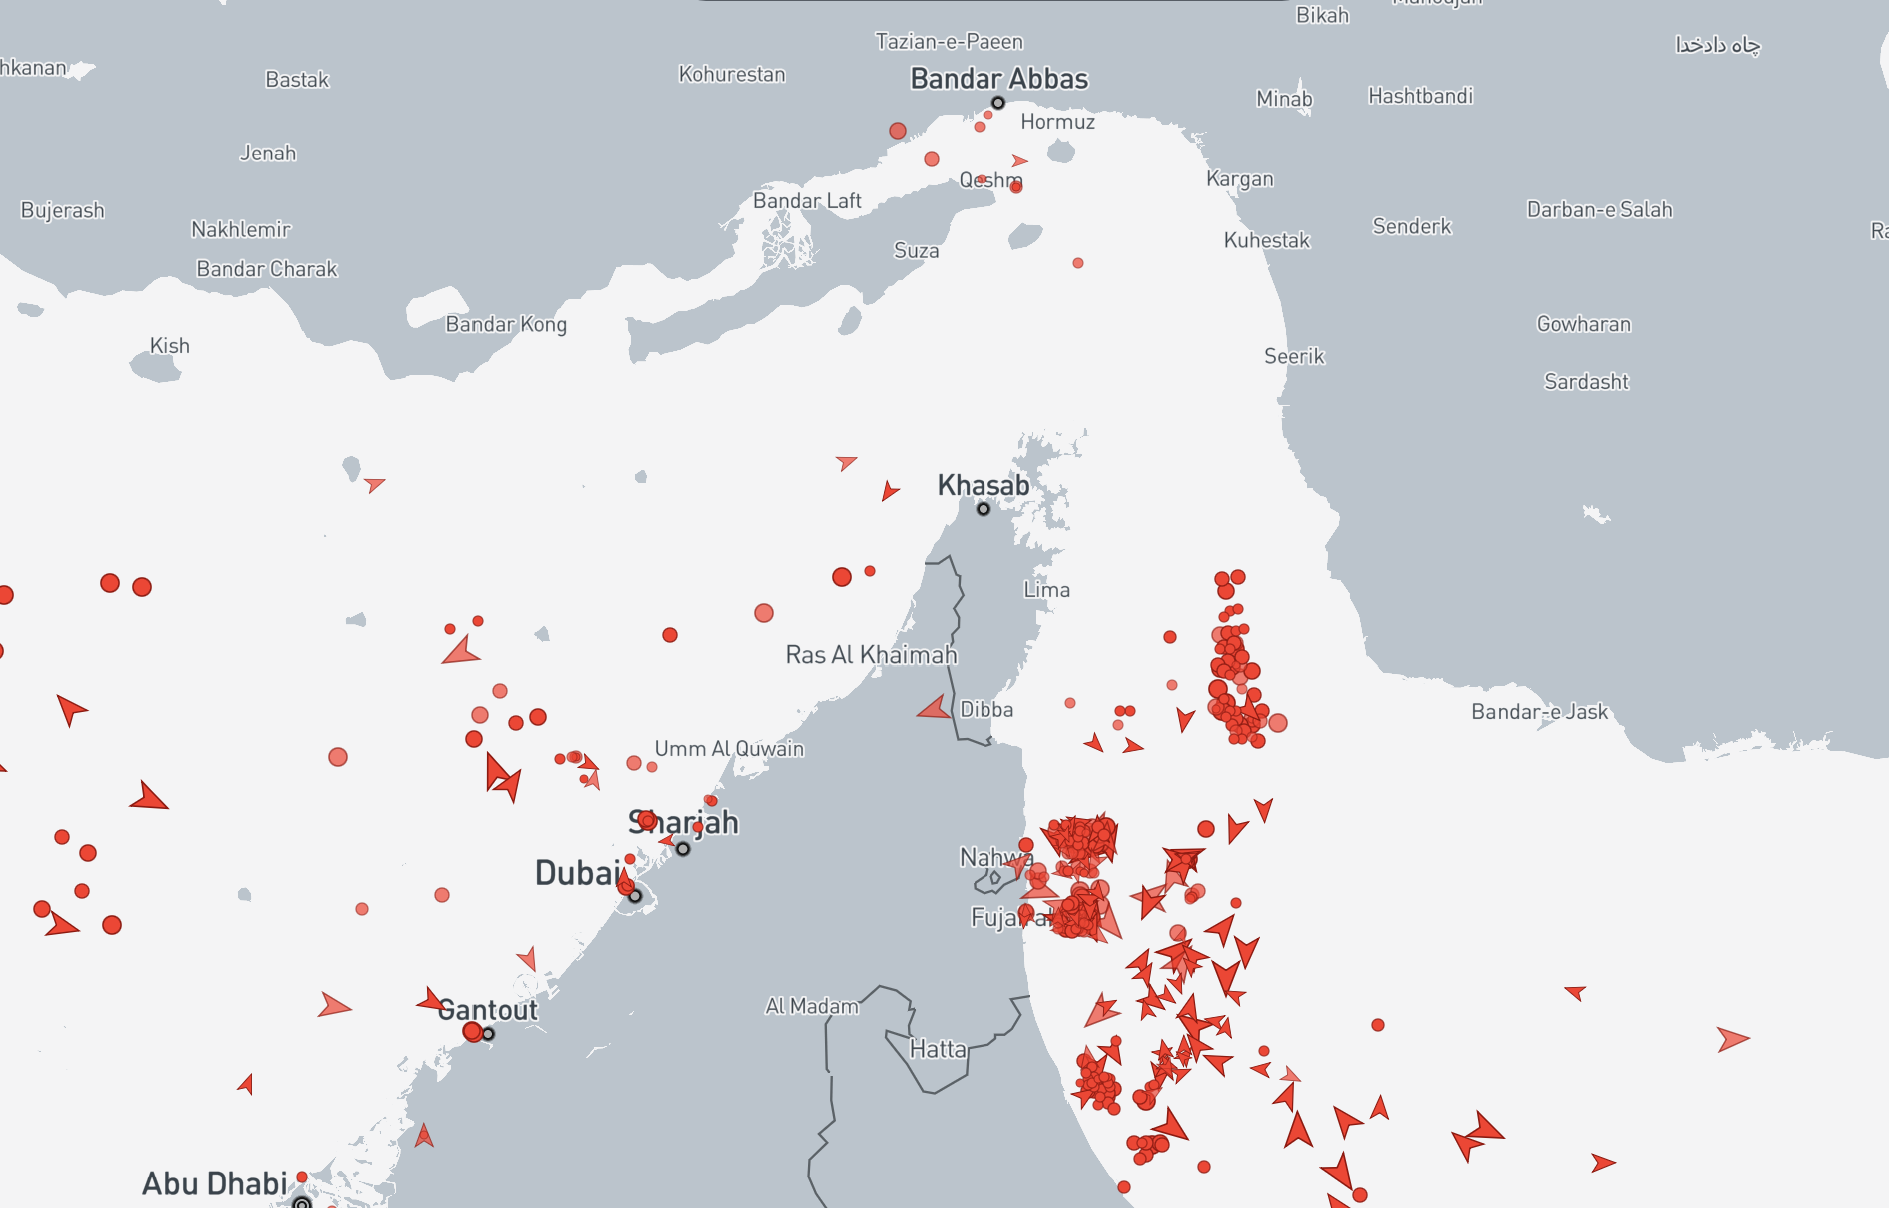
The Strait of Hormuz
The World's Most Dangerous Energy Chokepoint — How a 21-mile waterway controls one-fifth of global energy supply and threatens the restaurant industry
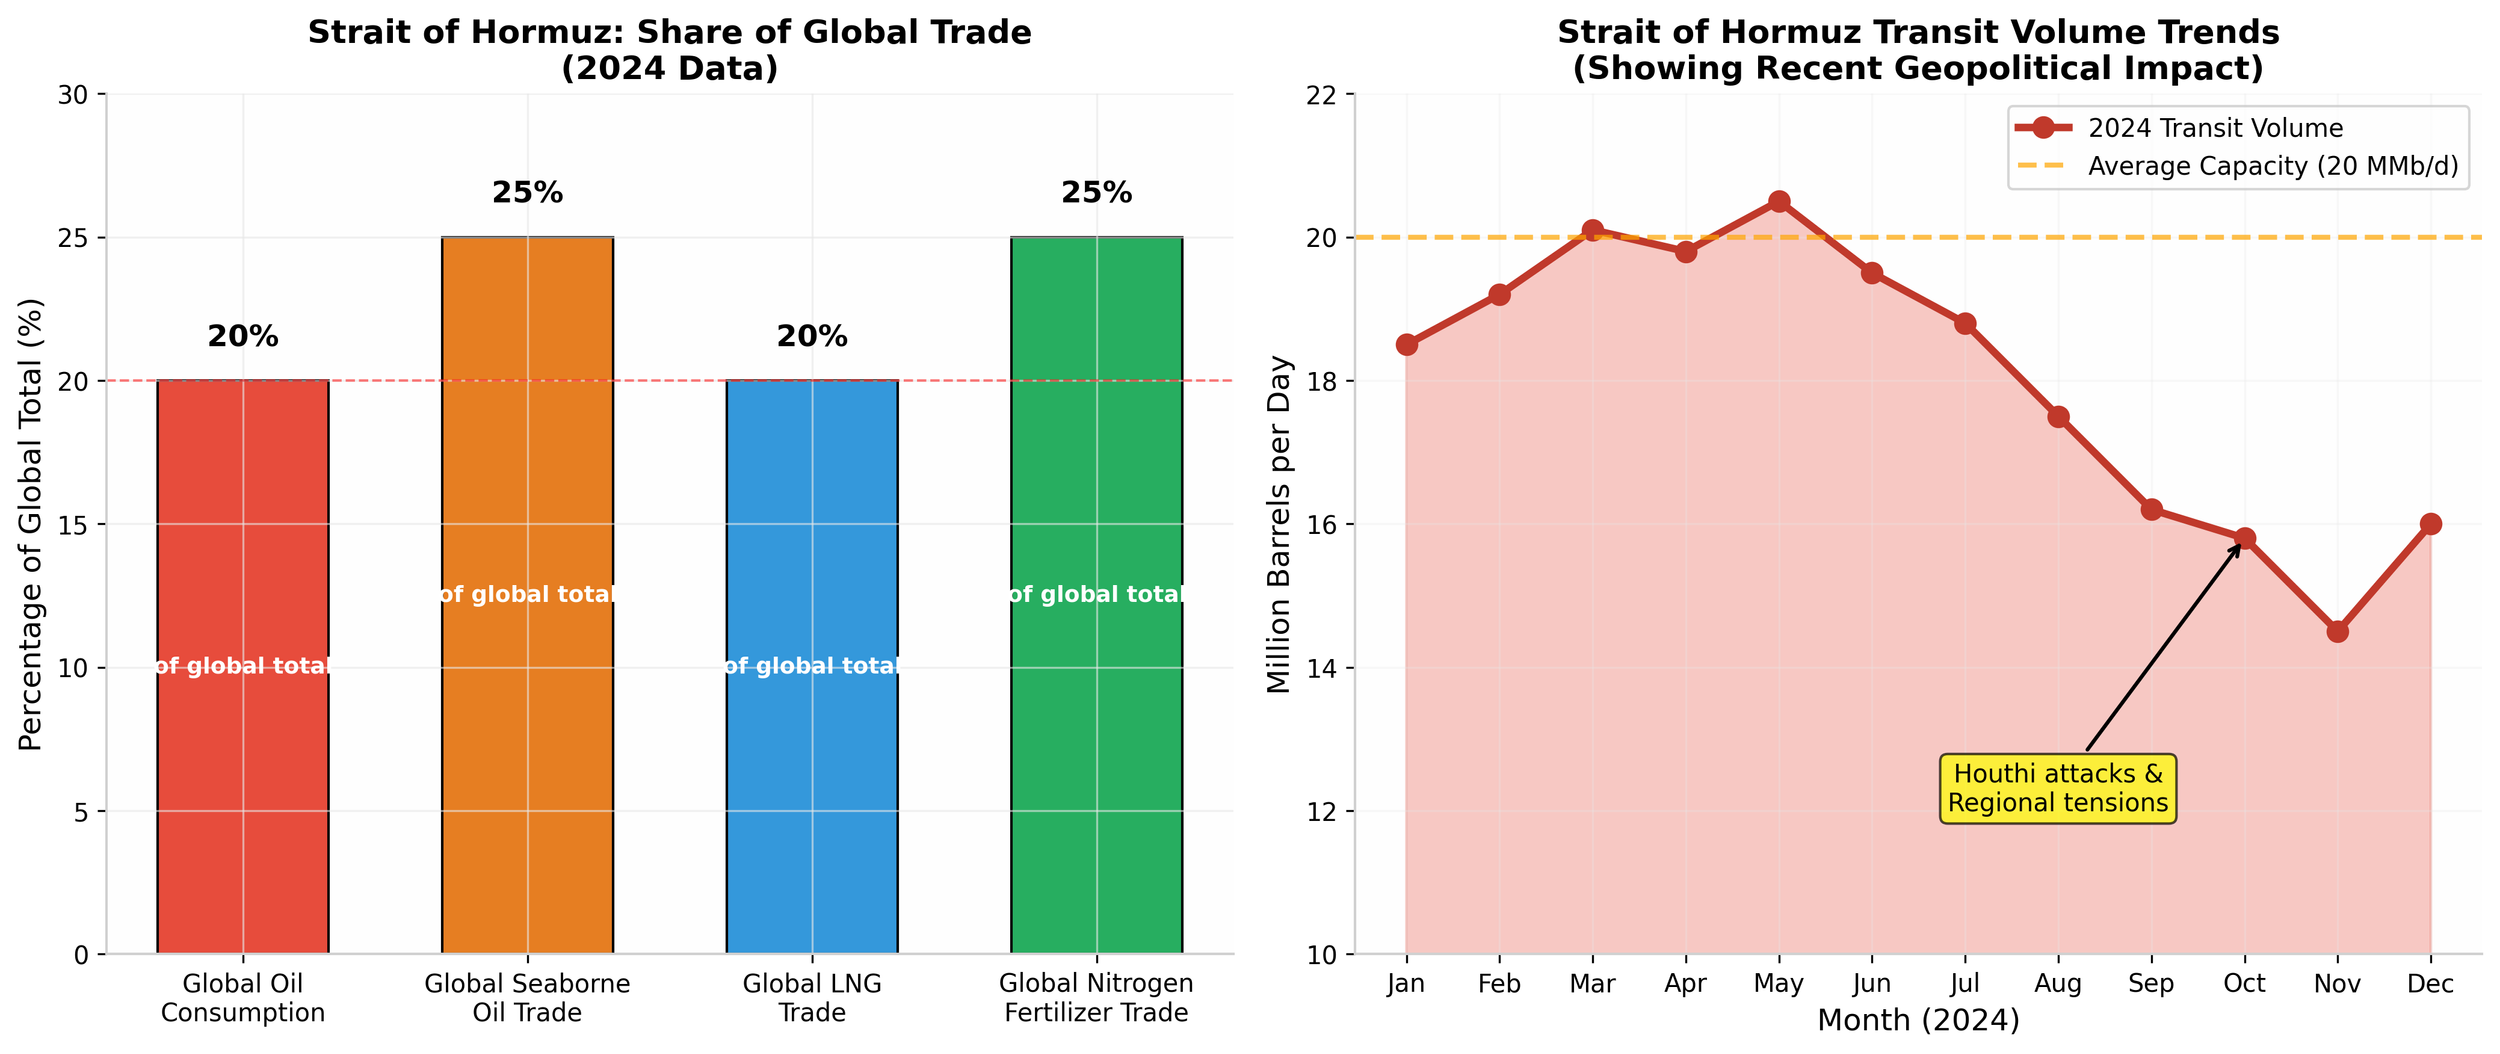
At its narrowest point, the Strait of Hormuz is just 21 miles wide. Yet this narrow channel between Oman and Iran serves as the maritime gateway for approximately 20 million barrels of oil per day—roughly 20% of global petroleum consumption and more than one-quarter of all seaborne oil trade.
In an era of energy transition, the strait's importance has not diminished. If anything, geopolitical tensions in the Middle East have made this chokepoint more volatile than ever. From Houthi rebel attacks to Iranian military posturing, the strait represents both the lifeline of the global economy and its most vulnerable artery—especially for natural gas which European restaurants are highly dependent on after the Ukraine war and the following sanctions on Russian gas companies.
A Dire Prediction
This was going to be Part 2 of our 4-part series on the demise of the restaurant industry that we predicted to be in near-total collapse by 2028. Now it looks as if 50% of restaurants in Europe and the US could be extinct and out of business by this Christmas.
Natural gas isn't just a direct cost—it also influences the broader economy, particularly restaurants and other hospitality businesses. During peak energy price spikes (2022–2023), some restaurants temporarily saw energy costs rise to 10–15% of revenue, particularly in the UK, Germany, Italy, and Spain.
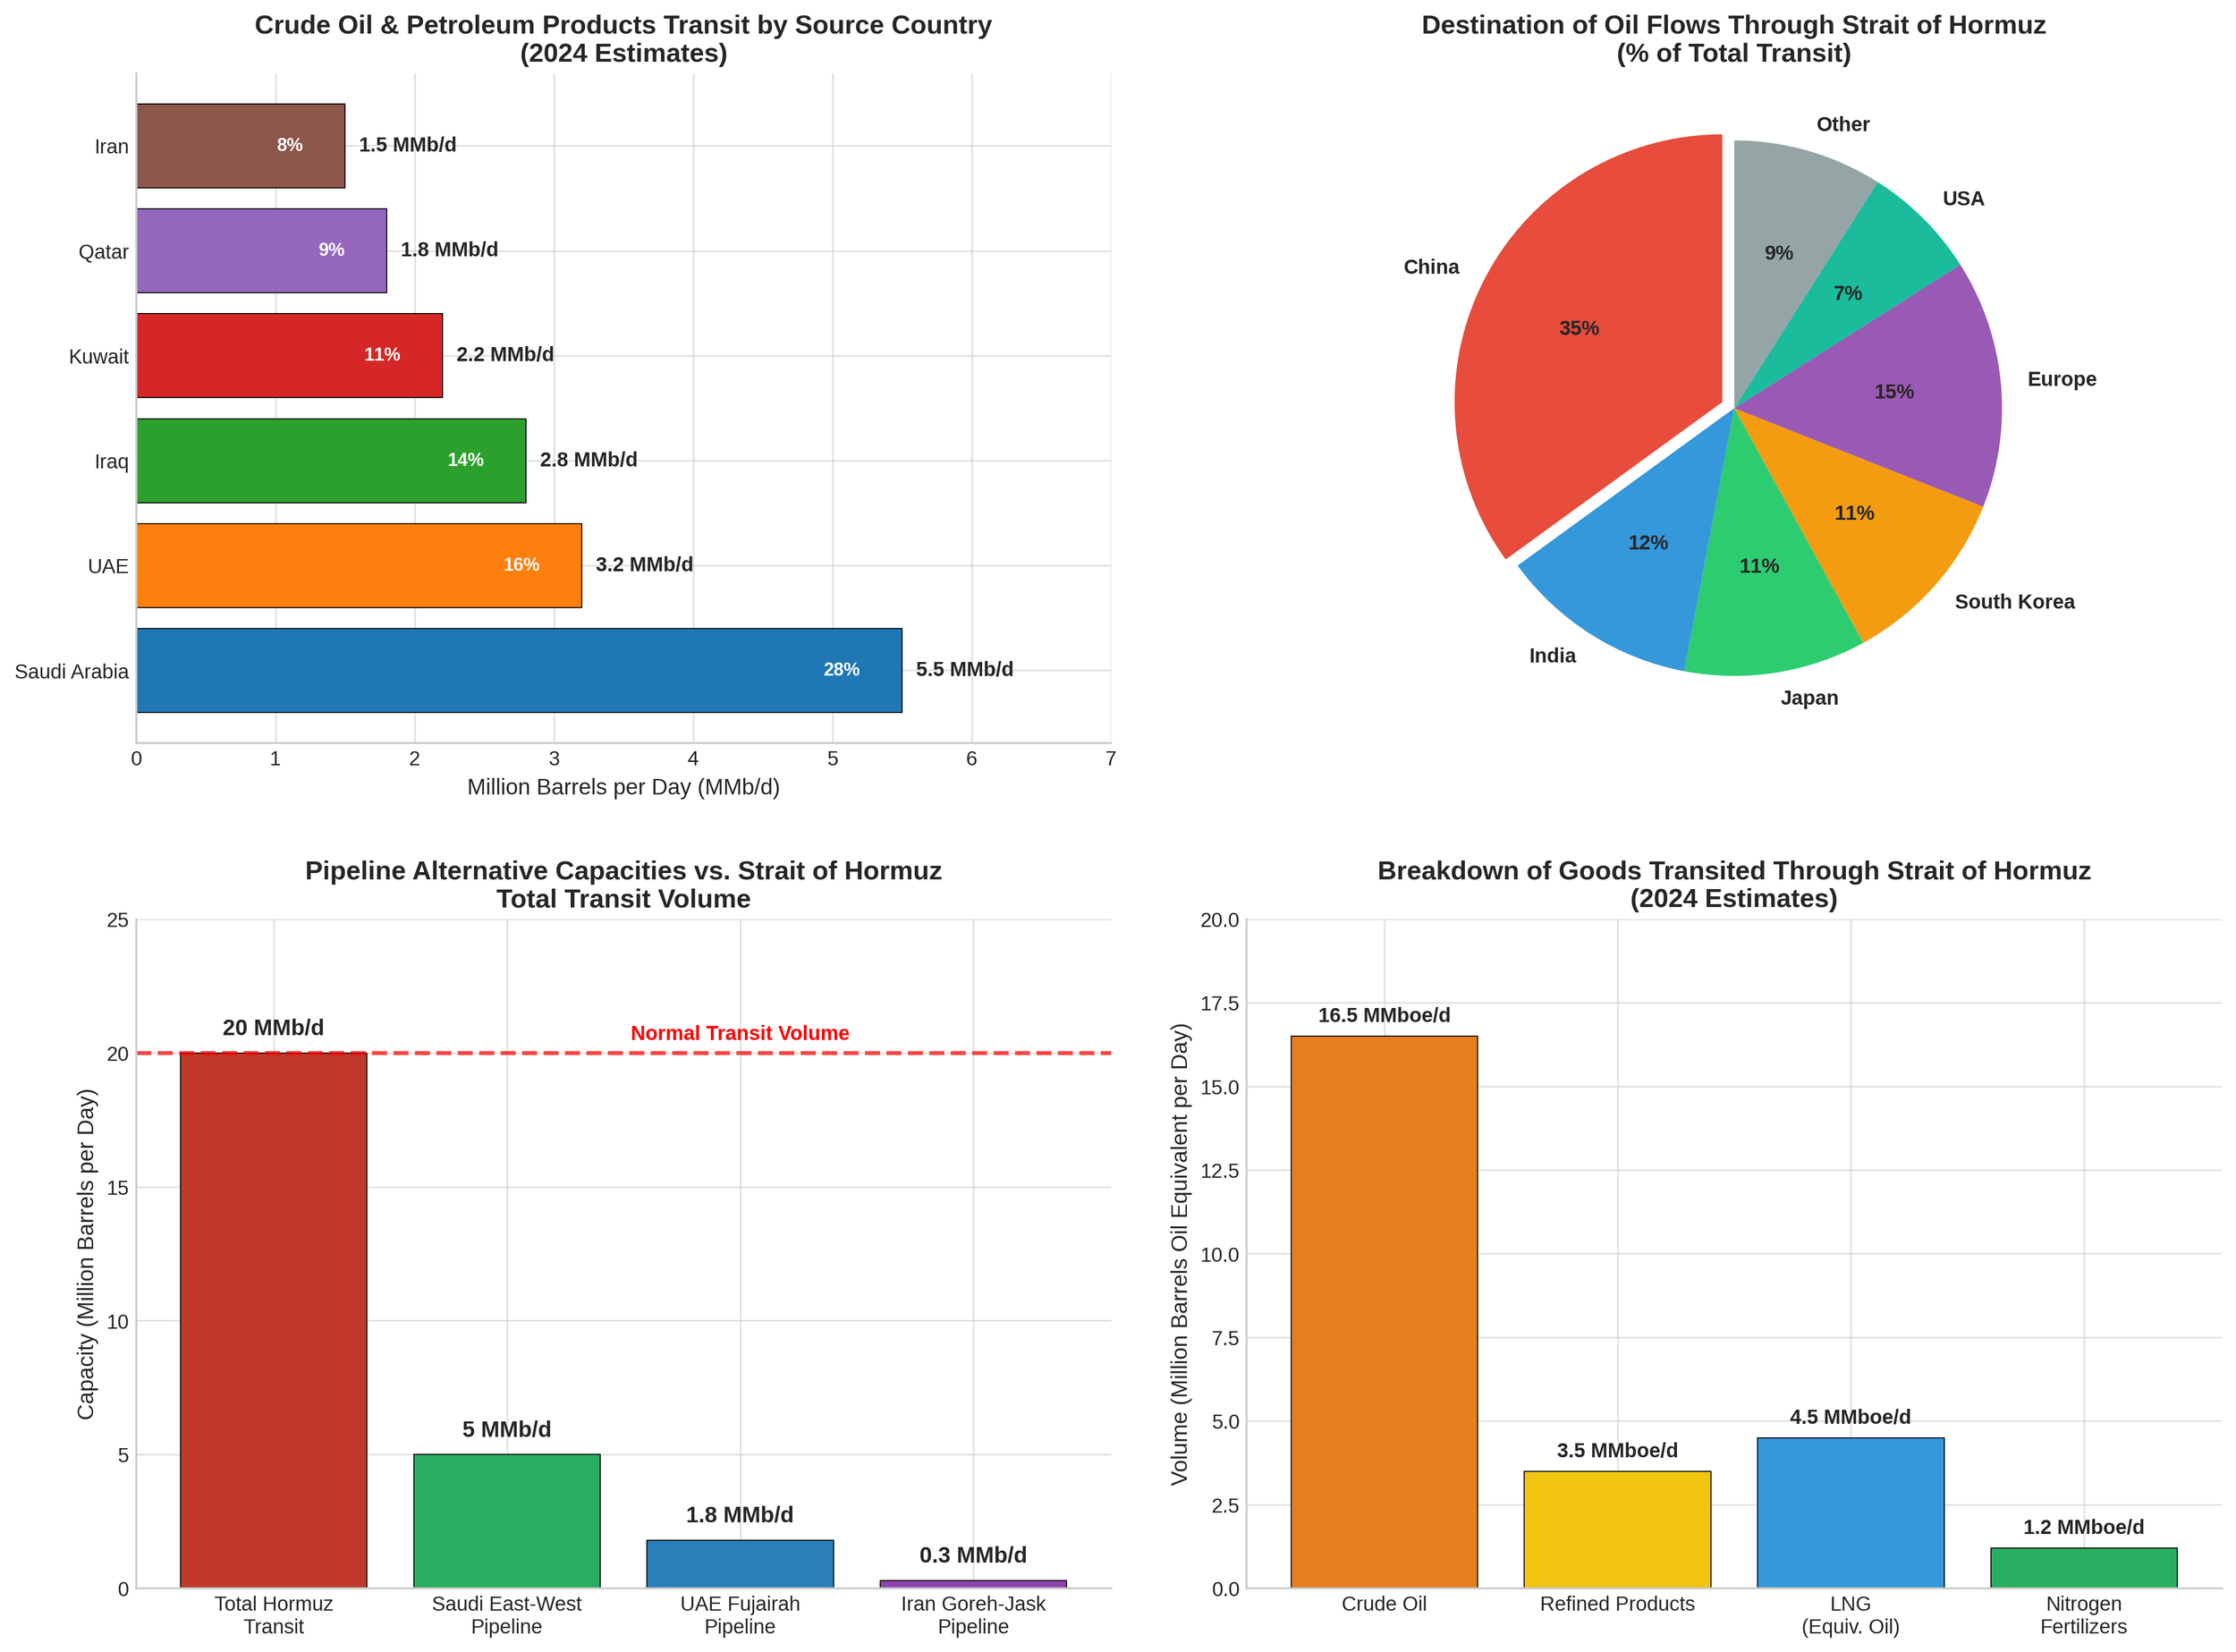
Daily Oil Transit Through Strait of Hormuz
Million barrels per day by country (2024 data)
Qatar adds another dimension entirely: The world's largest LNG exporter ships approximately 9.3 billion cubic feet of natural gas daily through the strait, representing roughly 20% of globally traded LNG. Unlike oil, which enjoys some pipeline alternatives, Qatari LNG has no other route to market—every cubic foot must pass through these volatile waters.
The Energy Cost Crisis
Kitchen energy usage is critical for restaurants. Many use natural gas for stoves, ovens, fryers, water heaters, and heating systems because it's efficient and often cheaper than electricity. When wholesale gas prices rise, the cost of running this equipment increases directly.
European energy costs are projected to increase between 25% (current impact) and 130%+ depending on how long the Strait remains effectively closed. The nightmare scenario—a prolonged closure combined with low storage and loss of Russian LNG—could push gas prices back toward the crisis levels seen in 2022 (€100+/MWh), with profound implications for industrial competitiveness, inflation, and household energy bills across the EU.
Restaurant Profit Impact: The Energy Squeeze
Annual profit/loss for a $1M revenue restaurant as energy costs increase (assumes 5% baseline profit margin)
Assumptions (transparent math)
Annual revenue: $1,000,000 | "Normal" energy cost: 5% of revenue ($50,000/year) | Baseline net profit margin: 5% ($50,000/year)
When energy prices rise, the extra energy cost hits profit dollar-for-dollar (no menu price change yet). At 10% energy cost, the restaurant breaks even. At 18% energy cost (reported in UK hospitality surveys during the spike), the restaurant faces an $80,000 annual loss.
Beyond Black Gold: The Fertilizer Factor
While energy dominates headlines, the strait carries a commodity equally critical to global stability: nitrogen fertilizers. Approximately one-quarter of globally traded nitrogen fertilizer—primarily urea—passes through Hormuz, with the Middle East accounting for 40-50% of global seaborne urea trade.
This carries profound implications for food security. Disruption to these flows wouldn't just affect energy markets—it would threaten harvests across Asia, Africa, and Latin America, potentially triggering food price spikes and political instability in import-dependent nations.
Ukraine War: Production Collapse
The invasion triggered an immediate and lasting agricultural contraction. Before the war, 90% of Ukraine's agricultural exports traveled through Black Sea ports. The Russian blockade caused a 90% drop in wheat exports during March–May 2022.
Research published in Nature reveals Ukraine's soils are being systematically stripped of nutrients. Nitrogen, phosphorus, and potassium are being removed faster than replaced due to reduced fertilizer access. Without nutrient restoration, Ukraine faces permanent productivity loss threatening its status as Europe's breadbasket.
The Compound Effect: Ukraine Production + Fertilizer Prices
Dual crisis creating a structural food supply deficit
The Feedback Loop: Higher energy costs → expensive fertilizer → lower yields/higher food prices → reduced farmer income → less investment in next season's inputs → further production declines. This cycle threatens to keep global grain production permanently below trend, even if the war ends.
Vulnerable Regions
The combined shock hits hardest in regions already struggling with food security:
& Middle East
Africa
Nations
With Ukraine's trend wheat and maize areas already 25% below pre-war trajectories three years into the conflict, and fertilizer markets facing renewed energy-cost pressures from the Hormuz crisis, the world faces a structural food supply deficit that temporary price drops cannot resolve.
The Perfect Storm
For the foreseeable future, 20 million barrels of oil and billions of cubic feet of LNG will continue to flow daily through this maritime gauntlet. The security of the strait requires naval presence, diplomatic forbearance, and the implicit threat of massive retaliation against any actor that dares close it.
In a world of fracturing supply chains and great power competition, the Strait of Hormuz remains the ultimate test of whether the international system can manage its most critical vulnerabilities—or whether geography, geology, and geopolitics will combine to disrupt the energy lifeline that powers modern civilization.
Coming Next: Part 3
The survival strategies for restaurants navigating the energy and food cost crisis—what works, what doesn't, and who will be left standing.
Data Sources
Charts and data analysis compiled from U.S. Energy Information Administration, Bureau of Transportation Statistics, and industry reports (2024).
Hello, World!